


05:00
Regime Shifts Interactions
Interactions
Amazon tipping points: 3-4\(^\circ C\), 1500mm rain, 40% deforestation, fire frequency?


Which will be hit first? How approaching one modifies another?
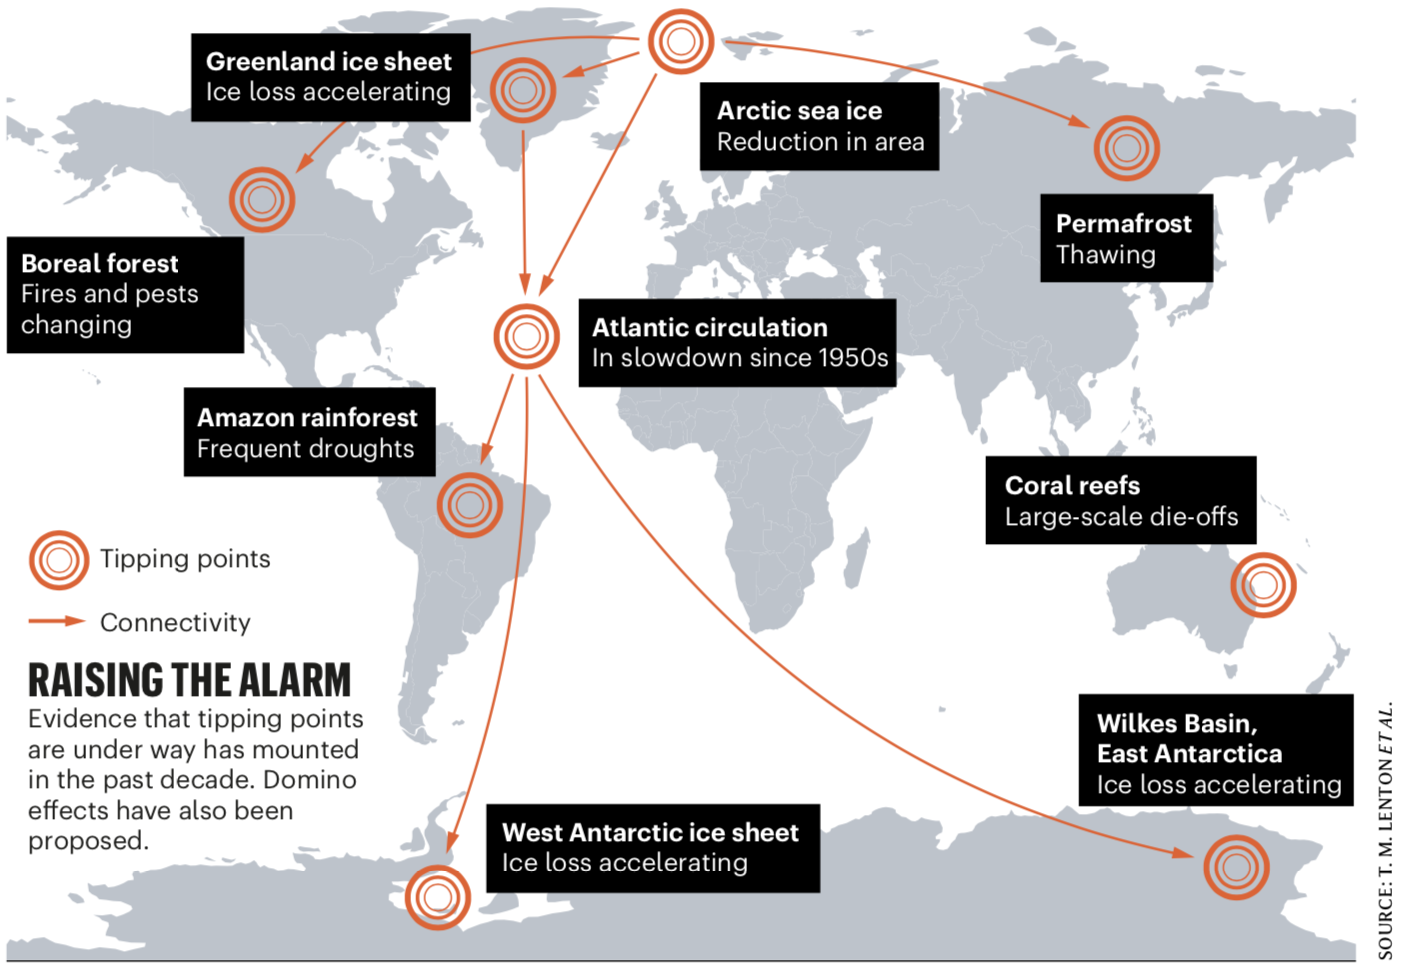
How do regime shifts interact?

Whether the occurrence of one will increase the likelihood of another, or simply correlate at distant places
Conceptual and theoretical work
- Tipping can hop between systems: \(X \rightarrow Y \rightarrow Z\)
Brummit 2015 - Coupled tipping systems do not leave early warning signals Dekker 2018
- Some network motifs (feedforward loops) can destabilize tipping cascades Krönke 2020, Wunderling 2020
Modelling and climate centered work. Are there other mechanisms?

Source: Regime Shifts Database
Method

A worked example

Cascading effects

~45% of the regime shift couplings analyzed present structural dependencies in the form of one-way interactions for the domino effect or two-way interactions for hidden feedbacks
Driver sharing

Aquatic regime shifts tend to have and share more drivers. The most co-occurring drivers are related to food production, climate change & urbanisation. 36% of pair-wise combinations are solely coupled by sharing drivers
Domino effects

Evidence of cross-scale interactions for domino effects was only found in space but not in time. The maximum number of pathways found was 4, and the variables that produce most domino effects relate to climate, nutrients and water transport
Trivia
What is your favorite take home message from their work?
Why does it matter? Earth Stewardship


Who has the agency to make a difference?

“Zoonotic EID risk is elevated in forested tropical regions experiencing land-use changes and where wildlife biodiversity is high” Allen et al 2017
Companies who extract natural resources
Shareholders who invested in them
Networks of shareholders with common investments

Regime shifts can be interconnected
- Climate is a central mechanism, but not the only one. Other mechanisms can trigger tipping cascades earlier than climate
- Multiple mechanisms means multiple opportunities for intervention
- Empirical evidence is missing: which connections are more relevant? what interventions has potential to slow down tipping cascades?